

A resource for COVID-19 modeling built and maintained by the University of Michigan EpiMath team.
We work on modeling, data analysis, and technology to inform and assist in pandemic response.
Here you can find different resources including models, infographics, and reports about the COVID-19 pandemic. We focus mostly on Michigan but also have some resources for the Midwest region. Explore the menu above or see below for some examples of the work we do.
Our team has developed several models for understanding and predicting COVID spread:
We build apps, tools, and explorables, including:
We develop a wide range of infographics and brief reports to help make sense of new information about COVID-19.

MI Safe Start Map: Track the risk levels of COVID-19 indicators

MI Symptoms: A free online tool built to help organizations screen their members for COVID-19 symptoms
Michigan COVID-19 Mapping: Putting COVID-19 in its spatial and social context
Ridge Regression Modeling updated
Michigan and Midwest data updated through 03/22/2021
MERC-region data update through 03/07/2021
UM Modeling updated
State and Regional Models updated
Stay-at-Home model added
Pause-to-Save-Lives model added
Interactive tools added April 2021
R0 explorable added
Vaccine Projections tool added
Additional Tools added
Model forecasts are generated using a ridge regression model, which is a machine learning approach that ‘learns’ patterns based on previous case, death, mobility, and vaccination data. This model has also been implemented at the national and state level as part of the CDC Forecasting Hub (see also the forecasting hub visualizer). Code and methodological details for the ridge regression model are available on GitLab.
Forecasts generated as of 12-13-2021. Case and death data are sourced from the JHU repository, and are plotted by report date.
For ease of viewing, confidence intervals are not displayed on the per million plots. To view the confidence ranges, please see the non-per million plots.
We use a range of compartmental transmission models to understand COVID-19 transmission patterns and explore scenarios around social distancing, vaccination, and other changing dynamics of COVID-19 in Michigan. We are actively working to provide model documentation and code for these models in the near future, but in the meantime, below are several brief reports of some of our modeling results. Several of these reports have also been presented in the Data and Modeling Updates for the state of Michigan.
This model was also used for regular forecasting early in the pandemic. To see our previous forecasts, please check out our old forecasting dashboard.
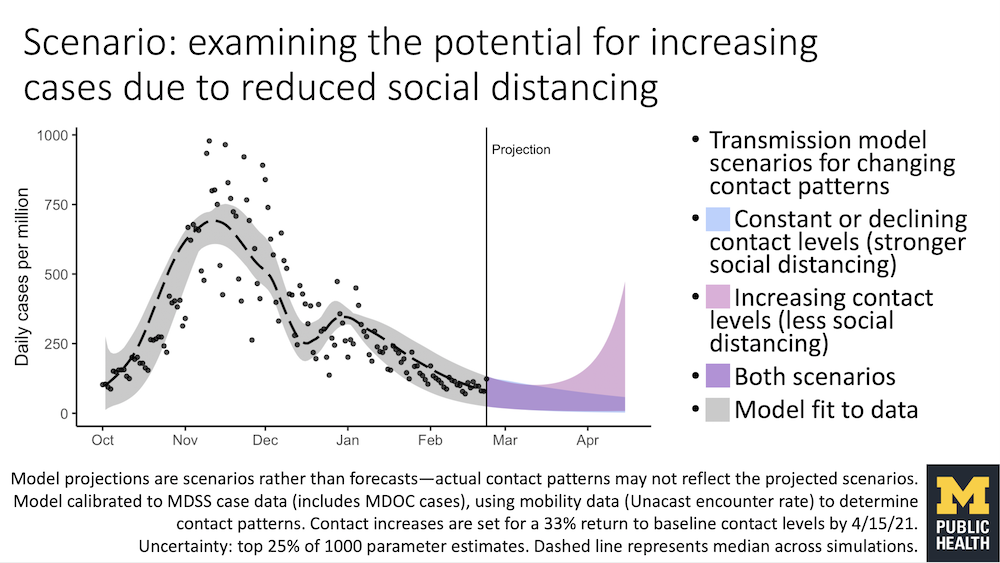
Modeling results from early March, examining the potential for a resurgence in COVID-19 if social distancing is not maintained.
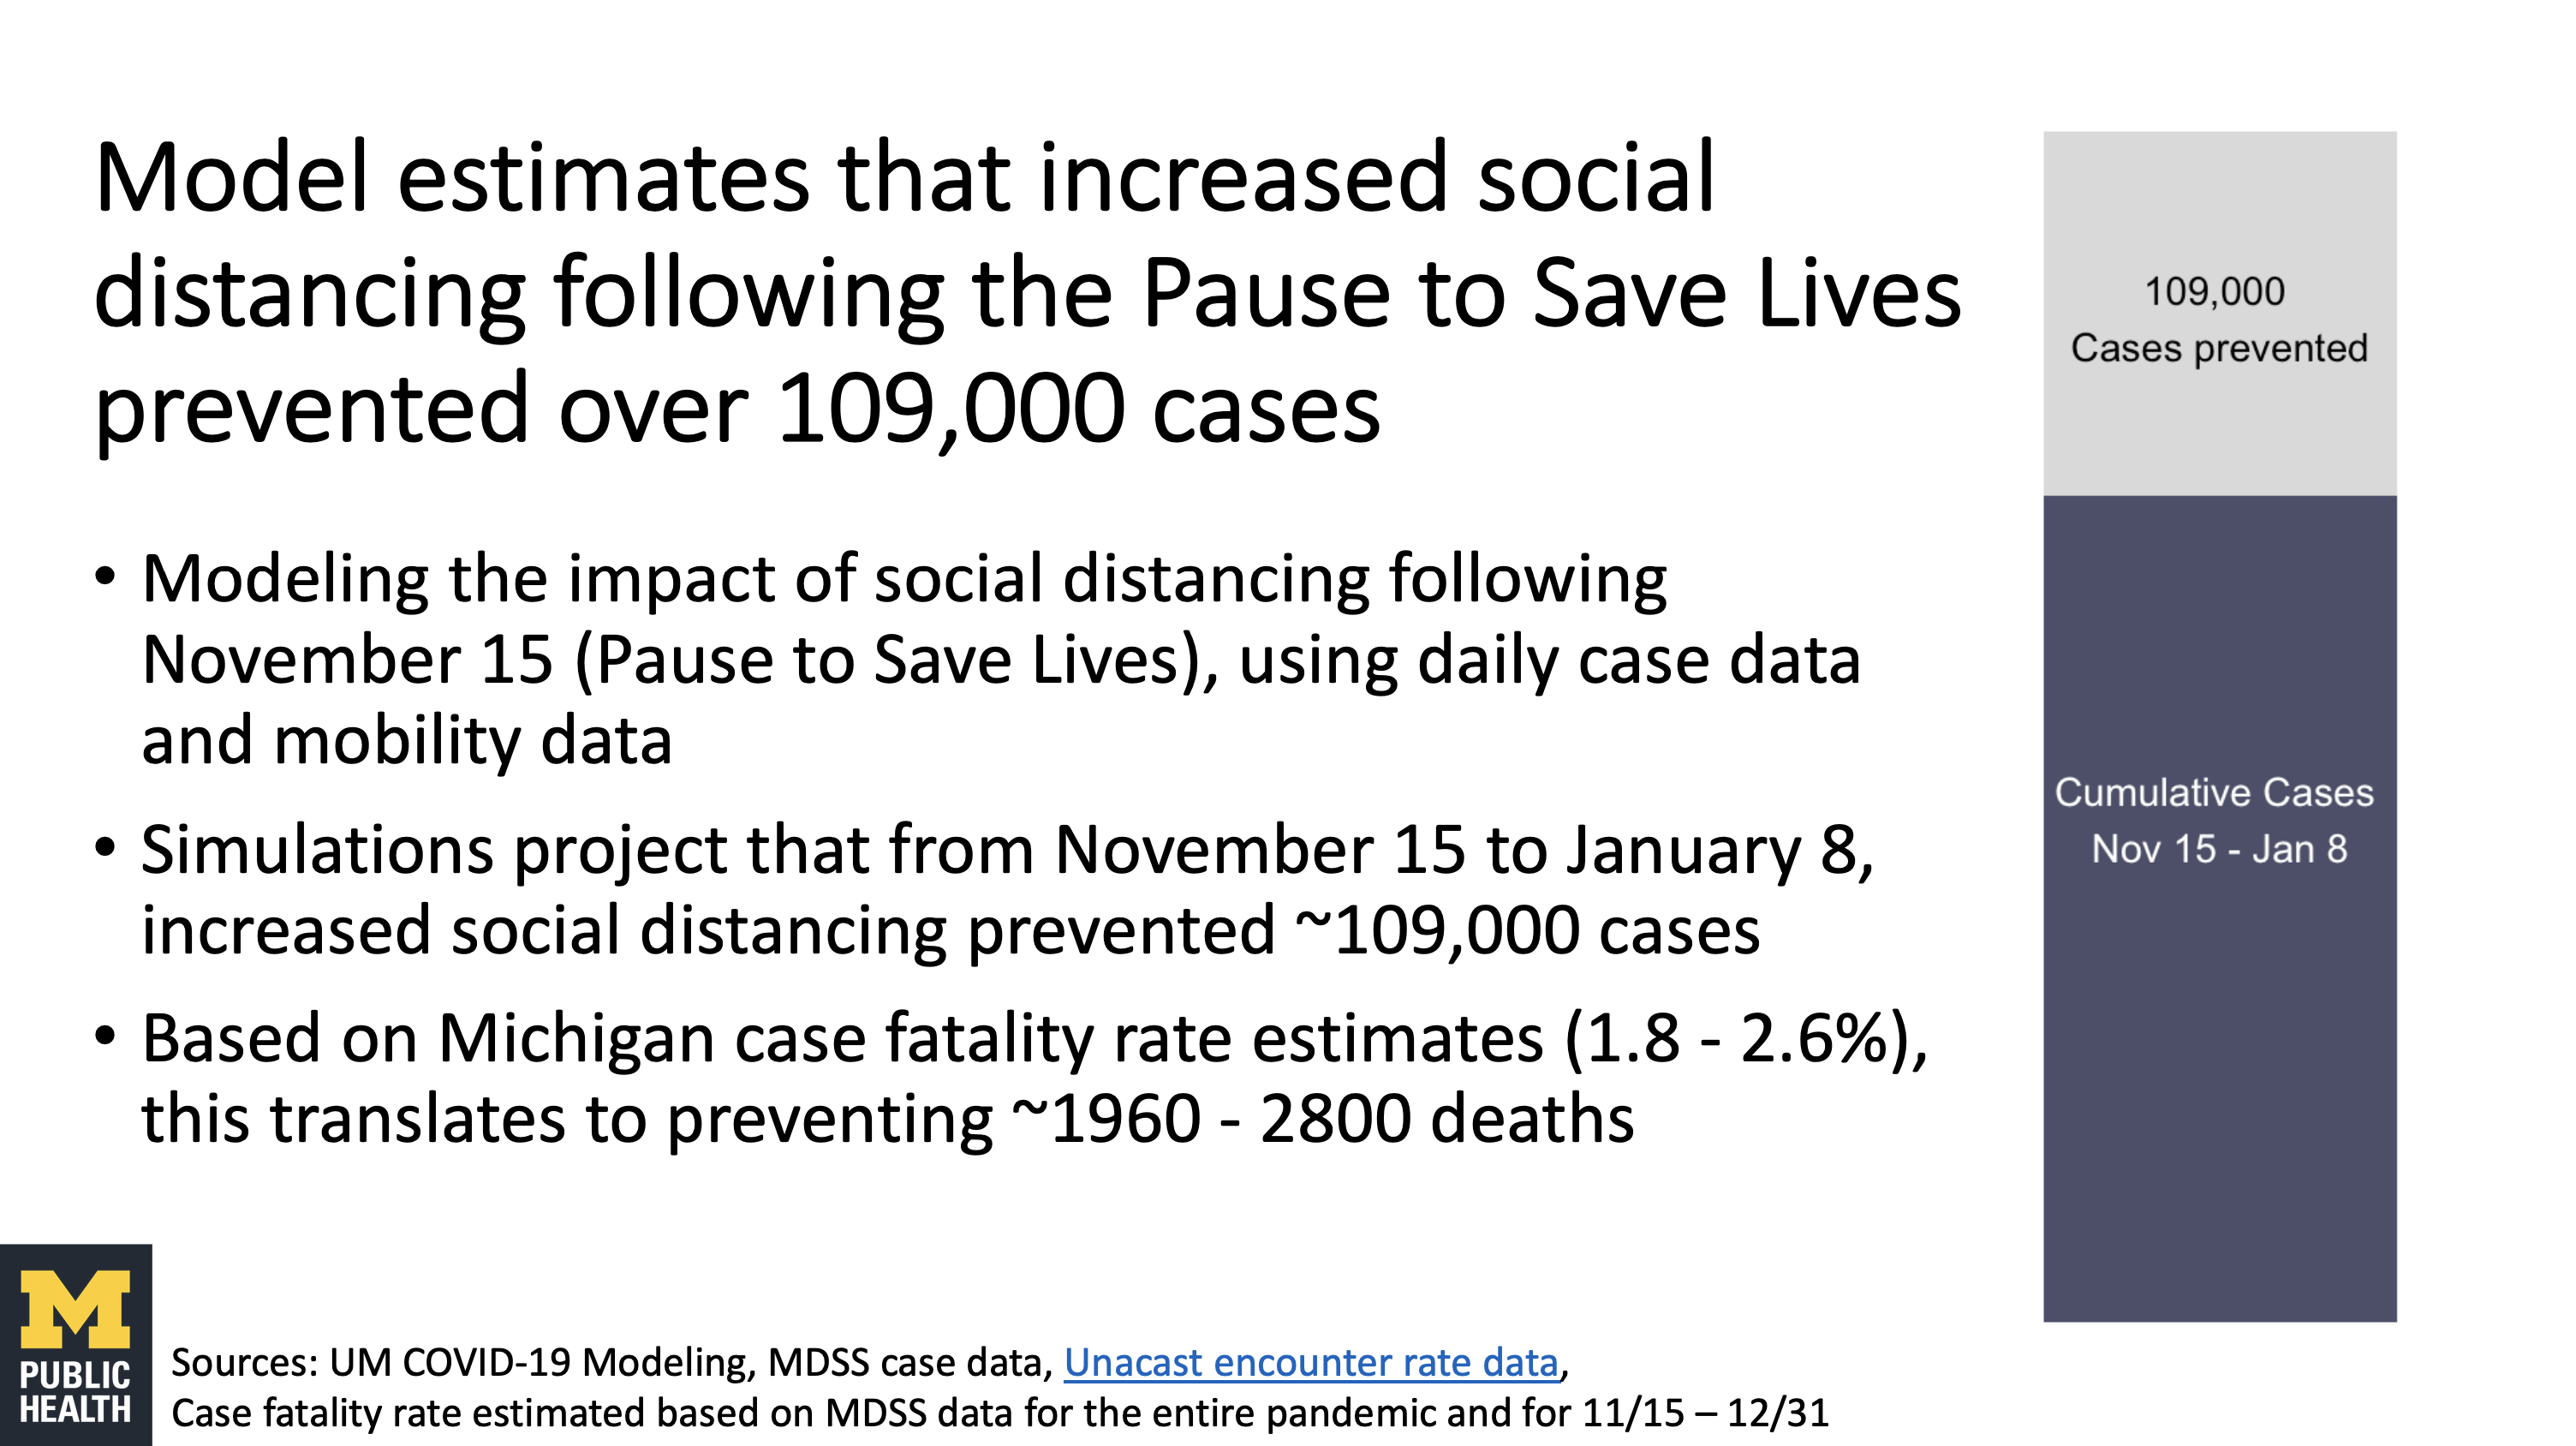
Brief modeling and data analysis report examining the impact of the Pause to Save Lives in Michigan.
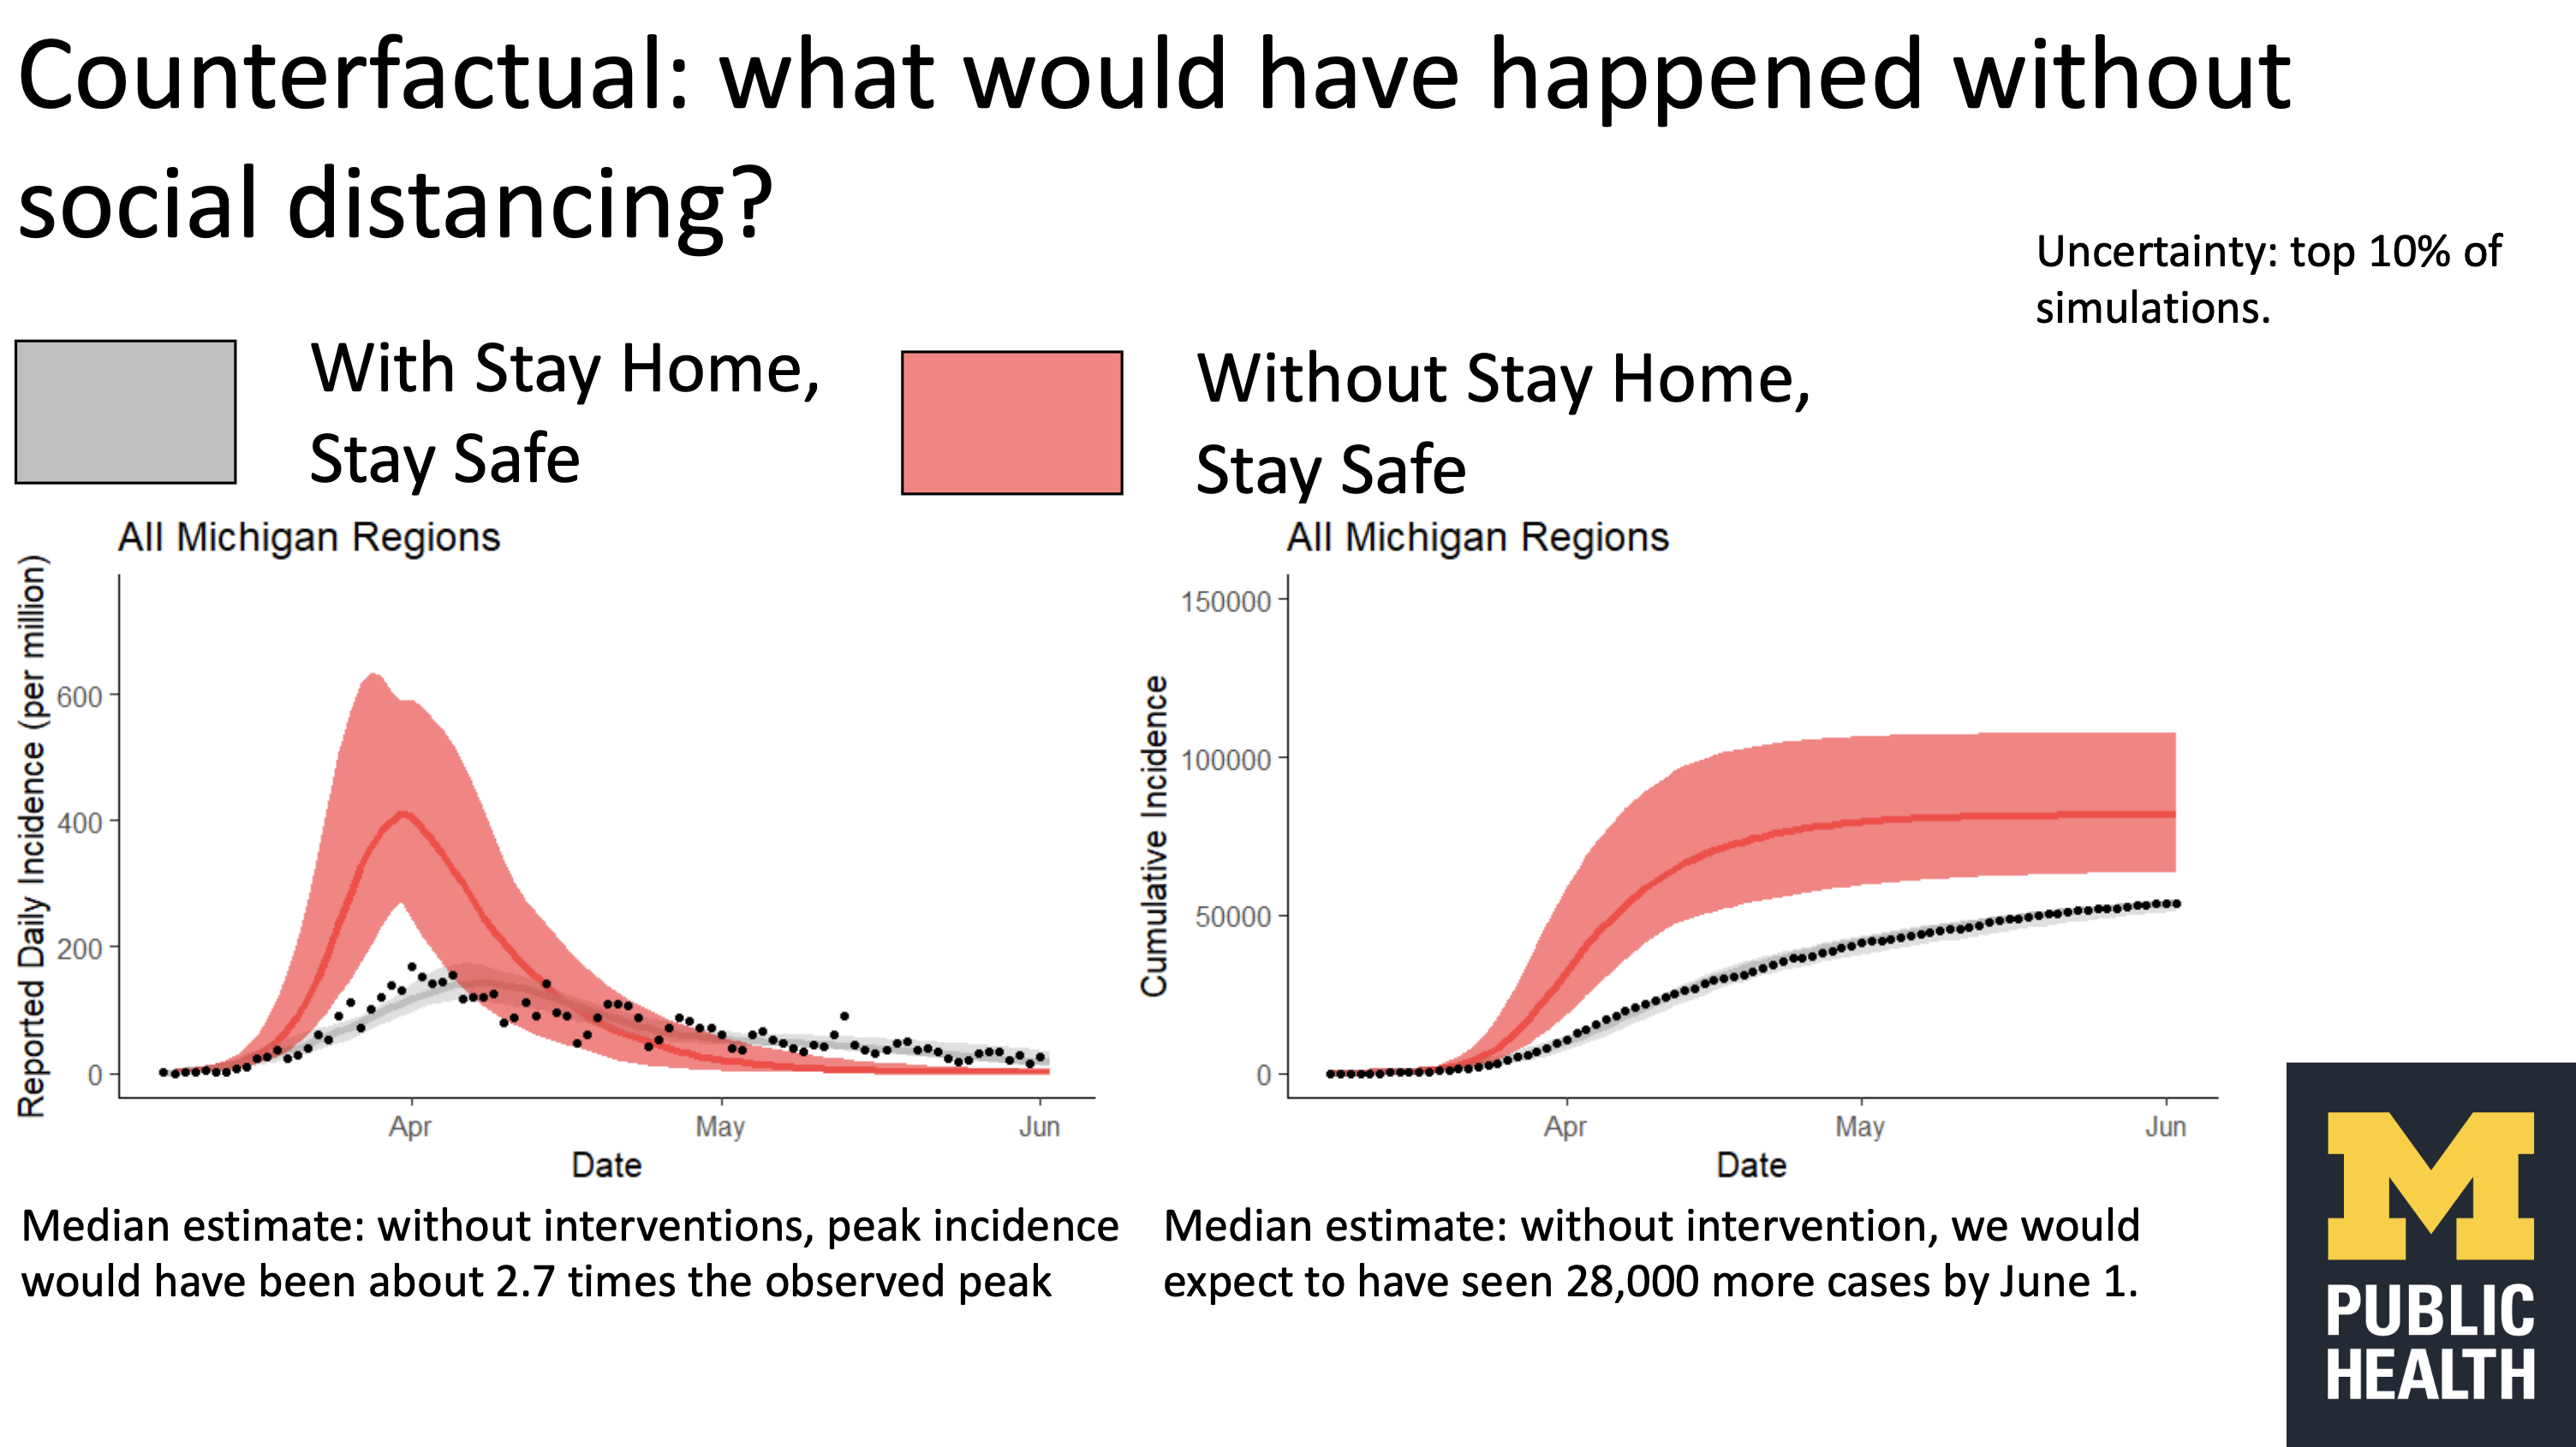
Brief modeling report examining the impact of the Stay Home Stay Safe order in spring 2020 of the pandemic.
We use a combination of compartmental and agent-based network models to examine COVID-19 transmission on campus at UM. More details will be added to this page soon, however in the meantime, more info can also be found by viewing a recent presentation on our modeling work (part of the MICDE and SPH symposium, Computing our way out of a pandemic: modeling in the face of COVID-19).
We’re actively working on adding code for all of our models, so please check back to this page for updates.
Currently the code for the ridge regression forecasting model is available here.
Members of our team have also worked on the following COVID-19 resources:
MI Safe Start Map: Track the risk levels of COVID-19 indicators
MI Symptoms: A free online tool built to help organizations screen their members for COVID-19 symptoms
Michigan COVID-19 Mapping: Putting COVID-19 in its spatial and social context
Additional explorables developed by DataEpi and colleagues of the DataEpi team:
Our team has developed a range of infographics to help understand COVID-19. Many of these infographics have also been presented in the Data and Modeling Updates for the state of Michigan.
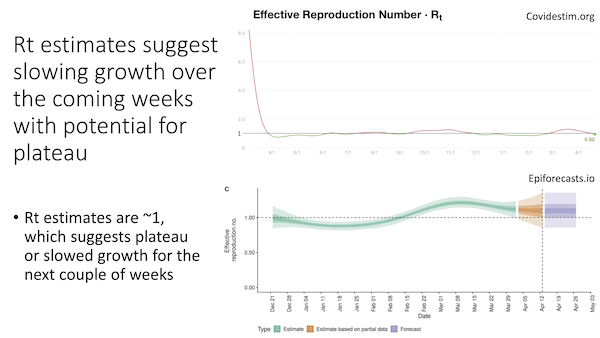
A modeling report examining whether the current spring 2021 case surge in Michigan is starting to plateau/decline. Estimates suggest slowing growth over the coming weeks with potential for plateau, however trends vary by region within Michigan.
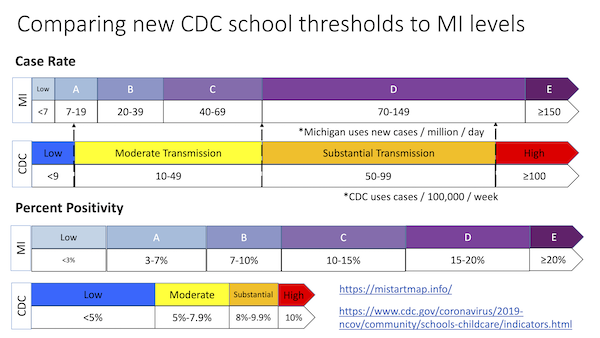
An infographic and explainer comparing the CDC school metrics to the MI start map metrics.
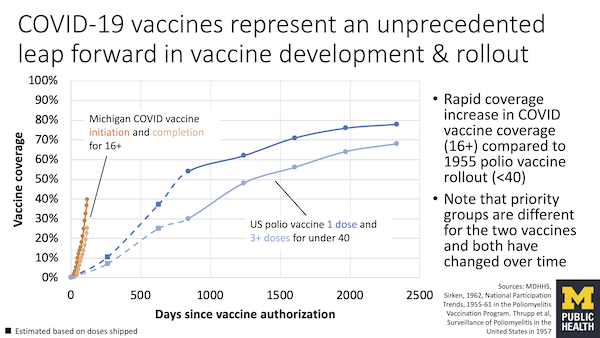
COVID-19 vaccine rollout has been rapid compared to historical vaccine rollout for polio.
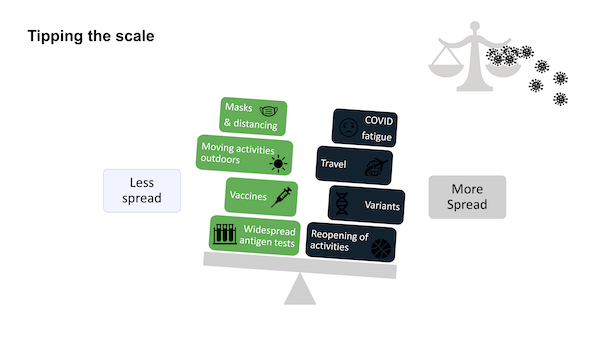
An illustration of some of the different factors that may lead to increasing or decreasing COVID-19 transmission (collaboration with Natasha Bagdasarian)
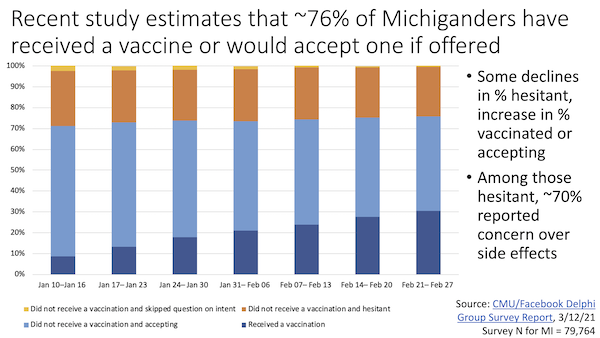
Recent estimates of COVID-19 vaccine hesitancy in Michigan based on the recent Delphi Group report. Approximately 76% of Michiganders report that they have received a COVID-19 vaccine or would accept one if offered.
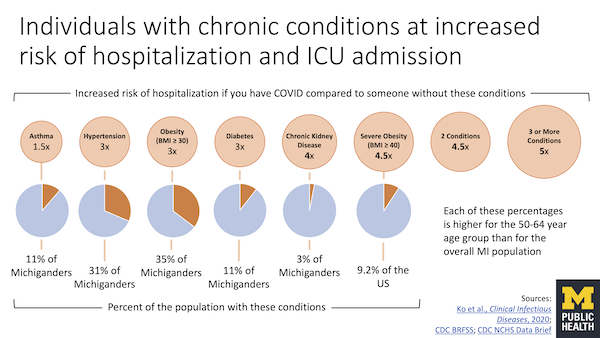
An infographic examining some of the chronic conditions associated with increased risk of hospitalization and ICU admission, and the percent of Michiganders with these conditions.
An infographic examining some of the chronic conditions associated with increased risk of hospitalization and ICU admission, and the percent of Michiganders with these conditions.
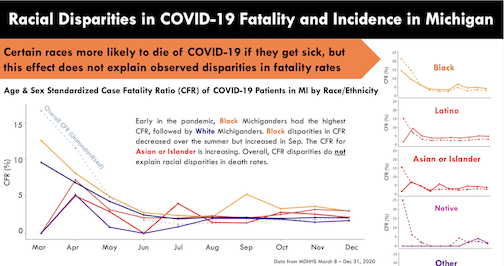
Infographic examining racial disparities in COVID-19 fatality and incidence in Michigan. Racial disparities in incidence rates explain observed disparities in COVID-19 fatality: People of color experience more fatality with increased exposure. Infographic by Ramya Naraharisetti & Nina Masters (covidmapping.org), based on Zelner et al., Clin Infect Dis. 2021 Mar 1;72(5):e88-e95. doi: 10.1093/cid/ciaa1723.
Also available on the web at covidmapping.org.
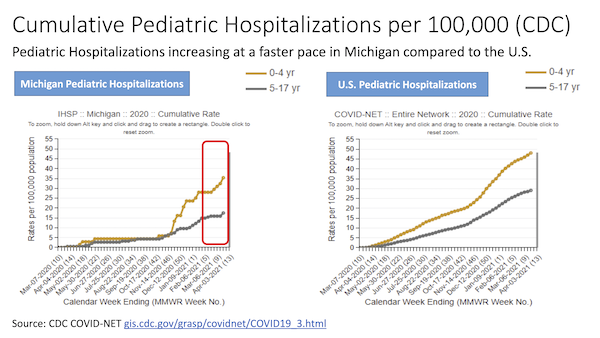
Infographic examining CDC data on March-April 2021 trends for pediatric hospitalizations in Michigan.
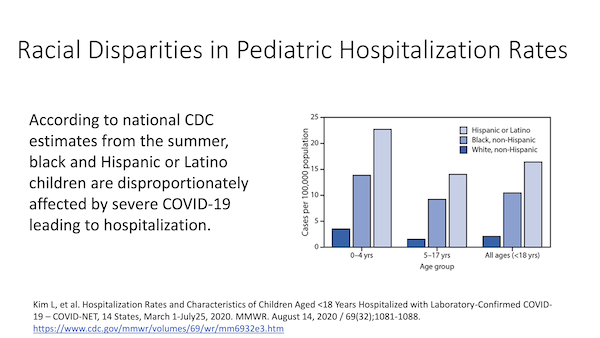
Infographic examining racial disparities in pediatric hospitalization rates. According to national CDC estimates from the summer, black and Hispanic or Latino children are disproportionately affected by severe COVID-19 leading to hospitalization.
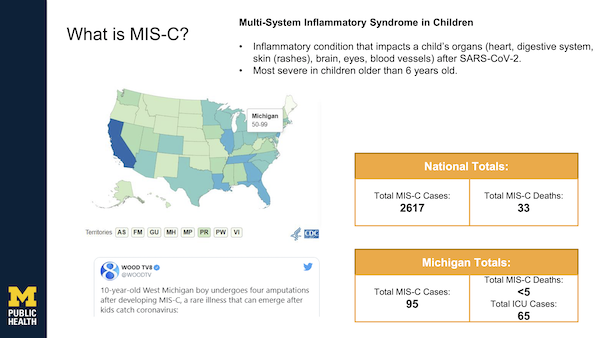
Overview and status update of Multi-System Inflammatory Syndrome in Children (MISC) in Michigan.
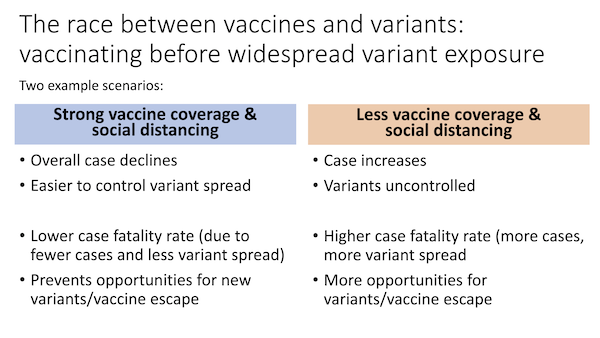
Infographic examining two scenarios in the race between vaccines and variants (collaboration with Natasha Bagdasarian).
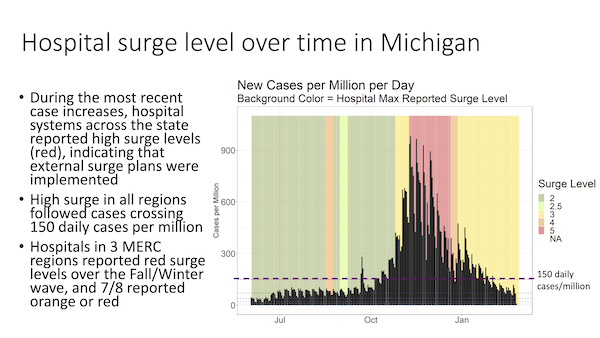
Slide showing hospital surge level and cases over time.
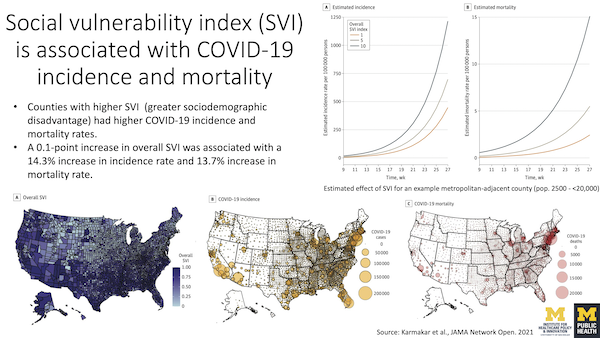
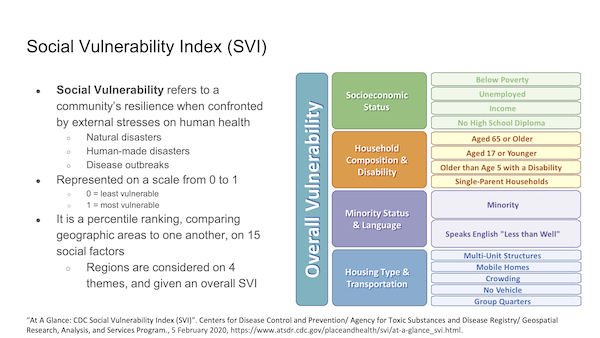
Infographic on a study showing that social vulnerability index (SVI) is associated with COVID-19 incidence and mortality in Michigan (Karmakar et al., JAMA Network Open. 2021).
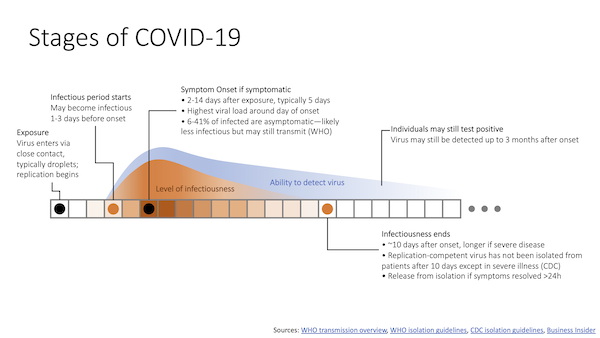
Infographic illustrating the stages of COVID-19 infection, from initial exposure, to symptom onset if symptomatic, and through the infectious period. The graphic also illustrates how virus detection and infectiousness change over the course of the infection.
Presentations
Commentaries, Amicus Briefs, etc.
Publications and Reports

Associate Professor of Epidemiology and Complex Systems


Administrative Assistant

Associate Professor of Epidemiology
Epidemiologist

Associate Dean and Millicent W. Higgins Collegiate Professor of Epidemiology

Project Manager

Designer

Research Assistant Professor, Epidemiology
Solution Architect Lead, Director of Infrastructure ActiveStep

Clinical Assistant Professor of Epidemiology


Data Analyst

Associate Dean for Research and Faculty Affairs and Professor of Information, School of Information


Assistant Professor of Epidemiology

Assistant Research Scientist, Epidemiology

Asssociate Professor of Physics


If you have any questions, please contact Marisa Eisenberg at marisae@umich.edu.
Social Distancing Scenarios
Row
Exploring Social Distancing
Row
Summary
Early in the growth phase, social distancing efforts tend to delay the epidemic peak further, while efforts later in the growth phase nearer the peak tend to reduce the epidemic peak more.
Start efforts before the peak of the epidemic: social distancing is generally more effective when it is started during the growth phase of the epidemic—once the peak has already occurred the impact of social distancing is often much less.
Continue efforts until after the peak of the epidemic: to avoid a rebound in cases after social distancing efforts stop, social distancing efforts tend to work best if they continue past the peak of the epidemic. This means it will be important to consider how to make social distancing efforts sustainable.
Limitations
While in the growth phase of the epidemic, projecting the height and timing of the peak or overall duration of the epidemic is highly uncertain. Thus, these simulations should be used to explore potential scenarios and general patterns regarding the impact of social distancing, rather than for prediction of specific numbers.
This model represents just one simulation from the range of realistic parameter values used for forecasting.
This model does not account for stochasticity, i.e. the effects of randomness in contact patterns and the disease transmission process. This means that the model will not be able to capture the potential for random extinction of the epidemic during long periods with very few cases.